Quote:
Originally Posted by EXEVO3

what do you mean over smoothed???
|
It looks like the data has been averaged out from lambda to give a smoother line - or possibly the sample rate was very low, e.g. it only took readings every .5 secs rather than every .1 secs.
By reading low I was thinking that the AFR looked rich the target AFR is usually around 11-12 yours is closer to 10 (i.e. around 1 richer than you would expect).
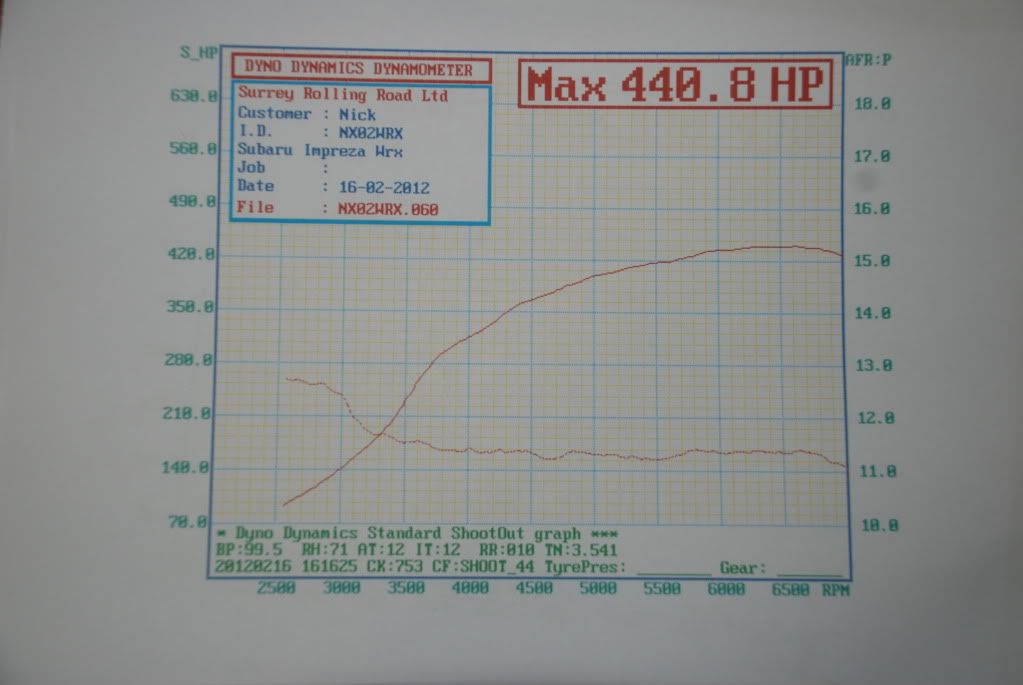
My graph below (SRR) shows a much more variable AFR plot (less smoothing 'averaging' or a higher sample rate) and the target AFR is clearly around 11.4
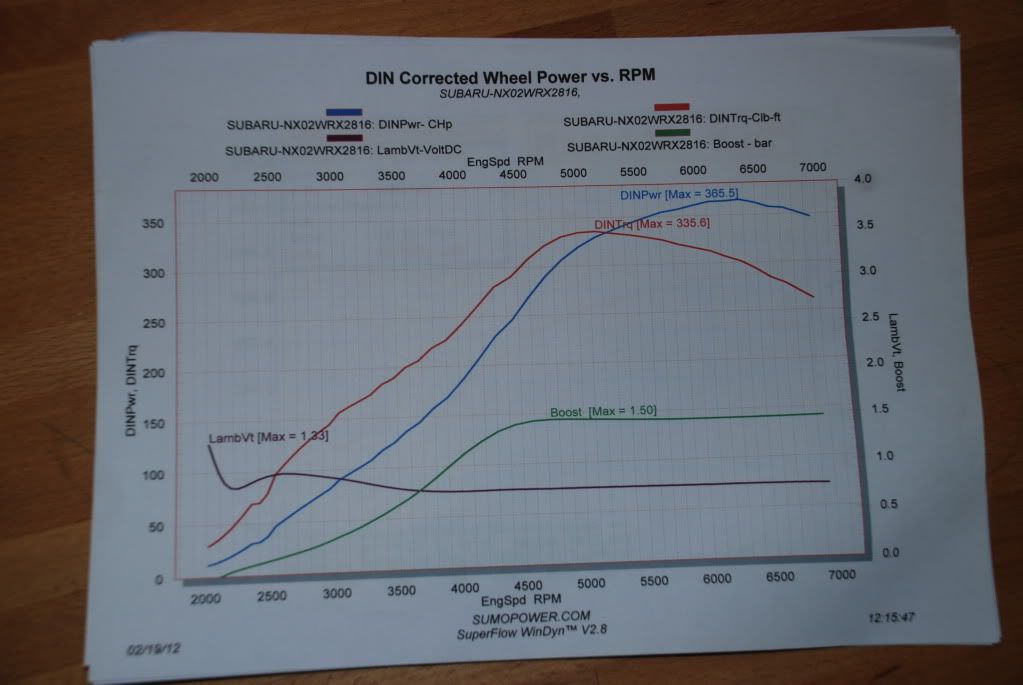
This is the same car on different rollers (JRM) in the same month - the graph has a greater degree of smoothing (e.g. the lines are less jagged) but shows the same data, although this time it's Lamda not AFR (Lamda of 0.75 = 11.1)
__________________
2005 Spec B 6MT - KiDO tuned (~270Bhp)
Custom exhaust - Cosworth filter - Samco Intake - Tints - Bilstein B8/B6 & STI springs - SuperPro ALK - Whiteline positive shift kit, rack mounts, rear adjustable camber bushes, front ARB mounts & strut brace, 20mm rear ARB with AVO mounts, - Hardrace Gearbox and pitch mounts - Prodrive PFF7's - Front Brembos - Kenwood CarPlay - 1/2 carbon grille - STI front splitter